Overview
Freeplay’s Observability dashboard is your window into understanding what’s actually happening in your LLM systems. As the foundation of the Monitor phase in Freeplay’s data flywheel, it captures production data including LLM completions, customer feedback, and system events and that feeds that information directly into your improvement cycle. By surfacing patterns and issues through evaluations and metrics, Observability helps you identify what to experiment and test next, creating a continuous loop of monitoring, analysis, and improvement that makes your AI application better with every interaction.Key Capabilities
Multi-Level Monitoring
Track your LLM interactions at multiple levels of granularity. Monitor individual completions to see full request/response details for each LLM call. Analyze traces to understand multi-step agent workflows and tool interactions. View sessions for aggregated user interactions and complete conversation flows. This hierarchical structure lets you zoom in and out as needed, from high-level patterns down to specific interactions. Learn more about the relationship between sessions, traces, and completions.Performance Metrics & Visualization
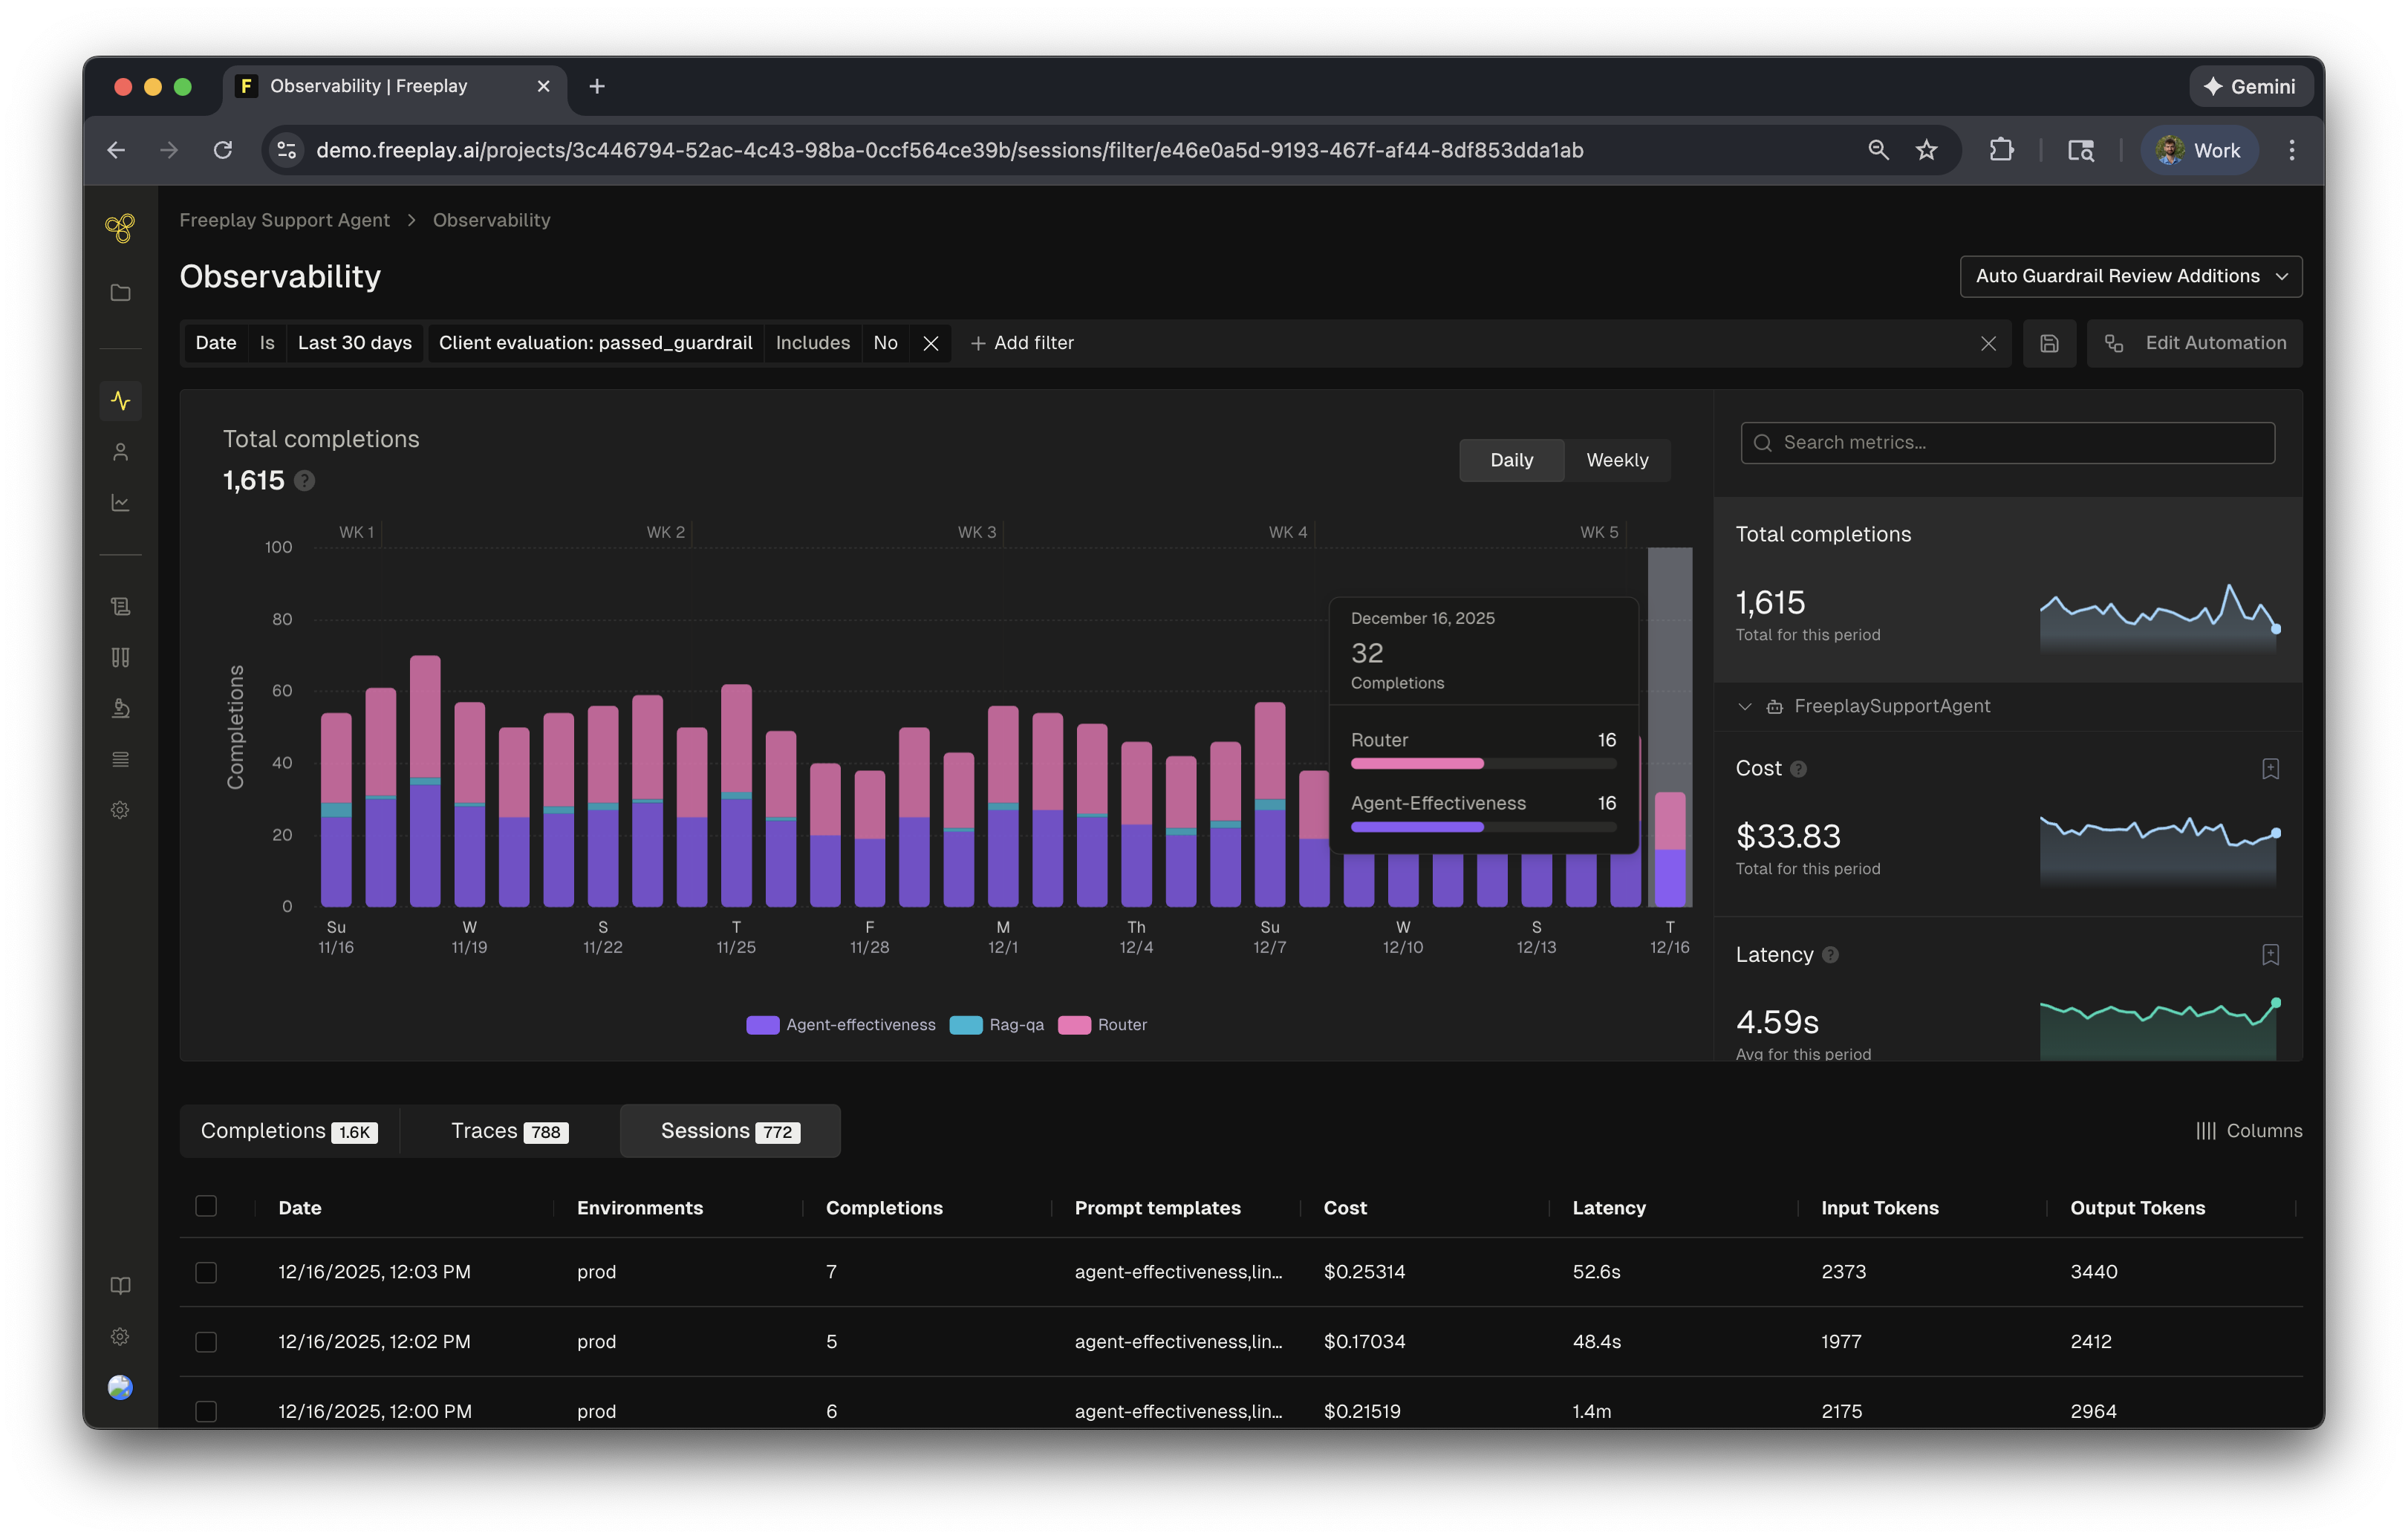
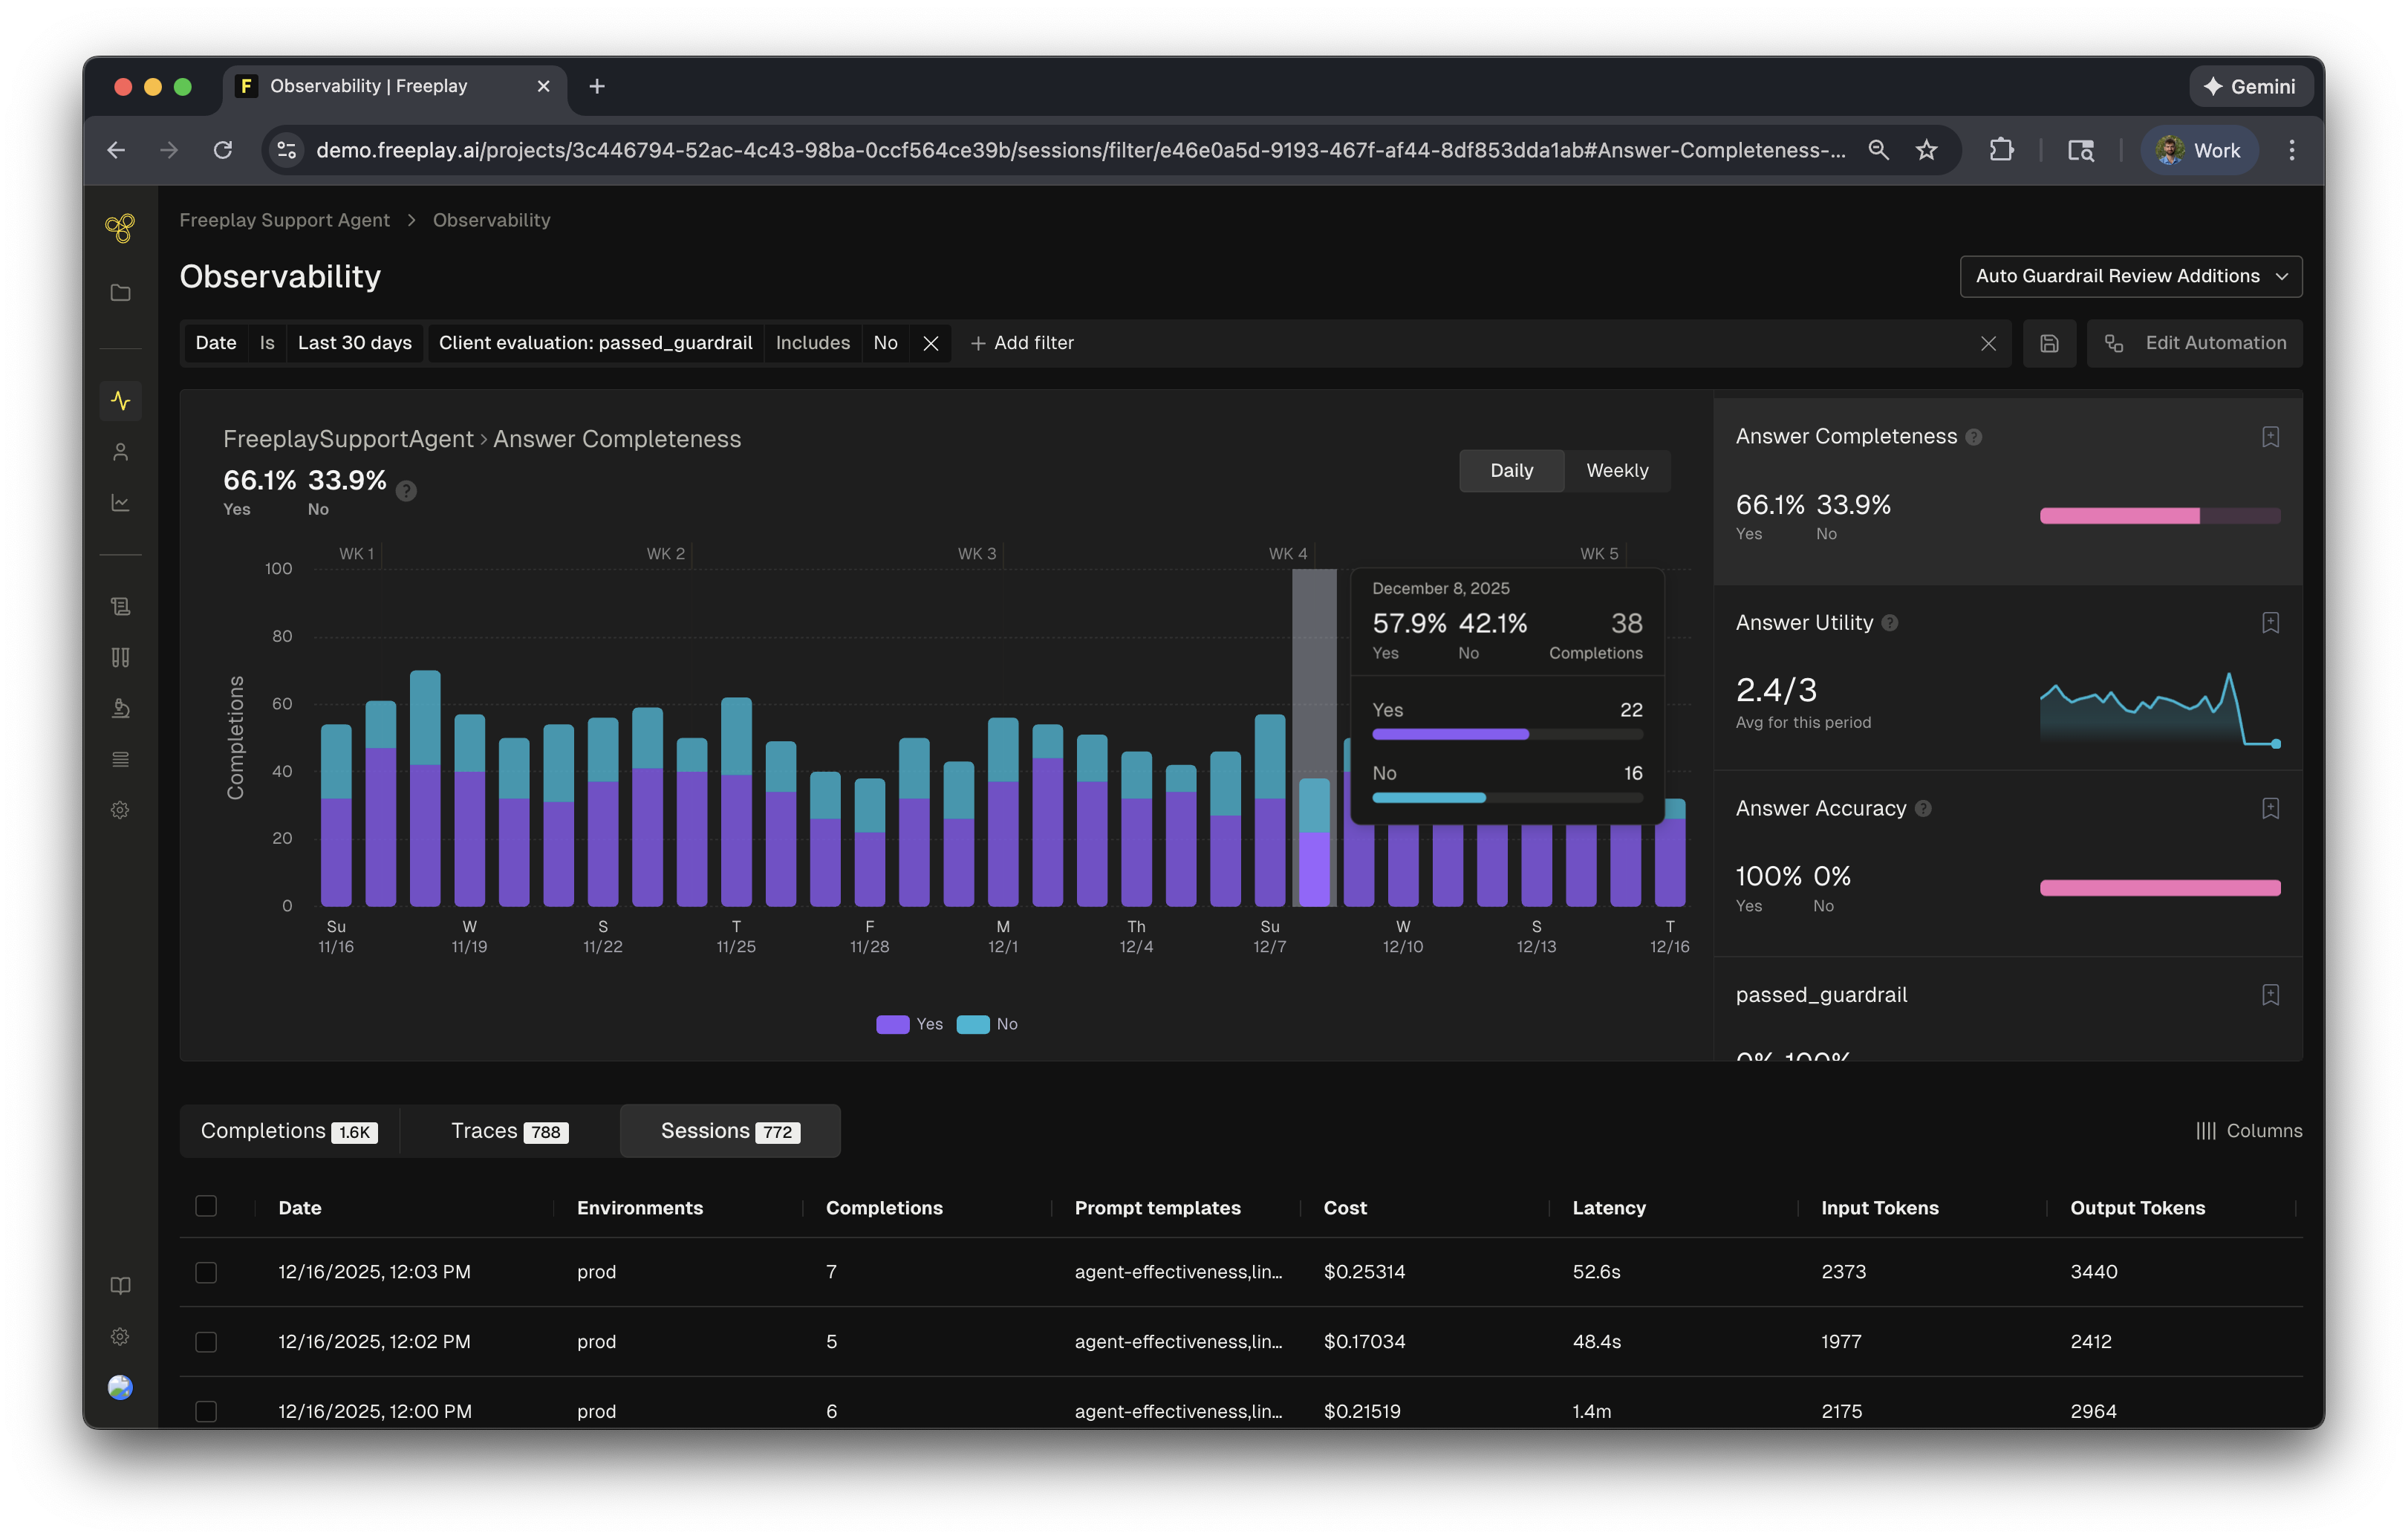
Track critical metrics through interactive charts and graphs that reveal cost trends across models and prompts, latency patterns that highlight performance bottlenecks, and usage volumes that show traffic patterns and peak periods. View evaluation results including model-graded evals, human labels, and custom metrics all in one place. Toggle between daily and weekly views to identify both immediate issues and long-term trends, with charts automatically updating as new data flows in for real-time visibility into system health.Advanced Search
Create powerful custom searches to focus on specific aspects of your system by filtering on prompt templates, model versions, environments, metadata fields, input content, or output patterns. Combine multiple filters for complex queries to isolate exactly the data you need. Save frequently-used searches for quick access and share filter configurations with team members to ensure everyone can monitor the same critical scenarios. This targeted approach helps you cut through noise to monitor what matters most for your application.Working with the Dashboard
Navigating Your Data
The Observability dashboard combines visual analytics with detailed logs to give you complete visibility into your system. Graphs reveal performance trends and patterns over time, while the table view lets you drill into individual completions, traces, or sessions for debugging. Together, these views help you quickly identify issues at a high level, then dive deep into specific interactions to understand root causes.Creating Actionable Insights
From any view in Observability, you can flag interesting examples to add to review queues for team evaluation and labeling. Build test datasets directly from production data to validate improvements. Using evaluations, labels and information logging you can create a rich understanding of your system’s behavior and be able to drill down to what matters.Team Collaboration
Freeplay’s Observability dashboard enables collaboration by letting you share direct links to specific completions, traces, or sessions with team members. Create and share team-wide saved searches for common monitoring scenarios, ensuring everyone has access to the same views.Common Use Cases
Production Monitoring
Set up saved searches to track error rates and failure patterns, monitor for performance degradation, and catch cost spikes or unusual usage patterns. Saved searches also help you quickly investigate customer-reported issues by filtering to specific time periods, users, or error types.Quality Assurance
Use Observability to regularly monitor your system’s production outputs and keep an eye on the evaluation metrics over time. The platform can help identify cases that need improvement and track how prompt performance changes over time as you iterate on your system.What’s Next