Freeplay provides a powerful set of tools to help you monitor, analyze, and take action on your log data. These capabilities build on each other:
- Custom Filters let you define complex queries to find specific data in your logs
- Saved Searches let you save important filters as reusable monitors that you can return to regularly
- Automations let you trigger actions automatically when logs match your saved search criteria
Custom Filters
When working with large volumes of production data, custom filters let you define complex boolean queries to find exactly the data you care about. Filtering is the foundation for all monitoring and automation capabilities in Freeplay. You can create filters directly in the Observability dashboard by selecting criteria such as:- Input and output values
- Evaluation results and scores
- Custom metadata (user IDs, session types, versions of your code, etc.)
- Prompt templates/versions
- Common metrics (e.g. cost, latency, token usage)
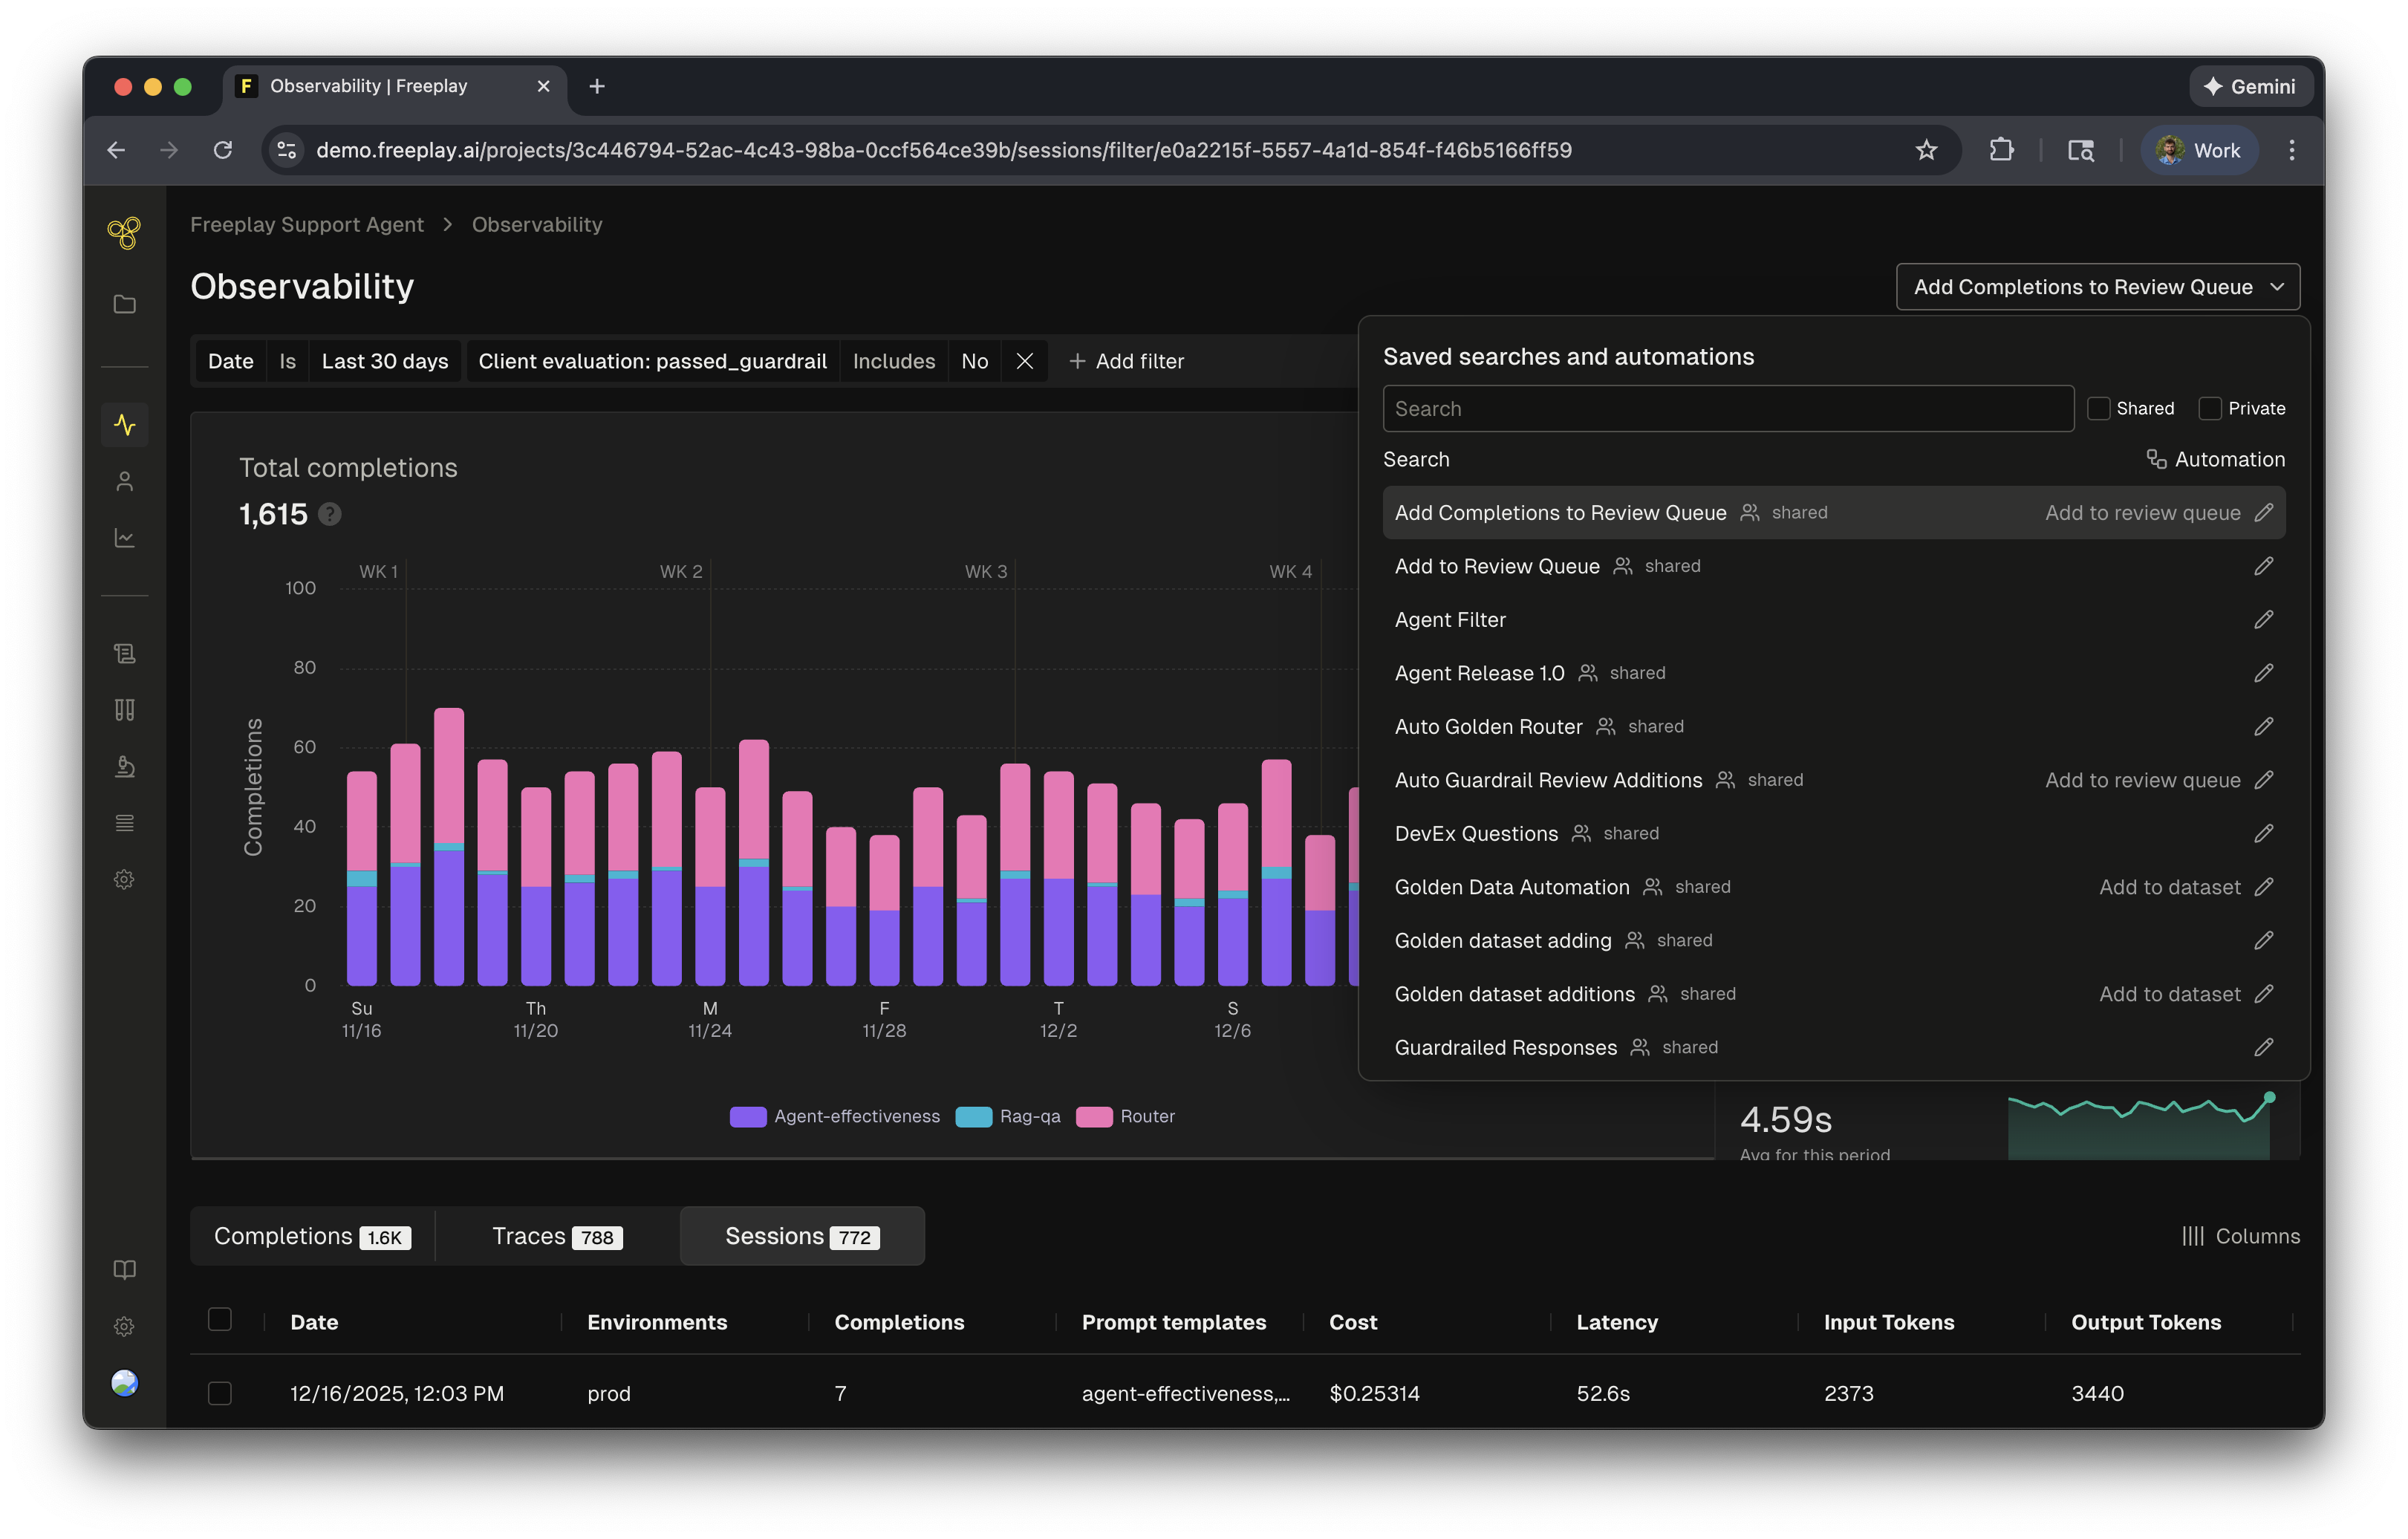
Saved Searches
Once you’ve defined a filter that surfaces important data, you can also save it as a saved search to return to it easily. Saved searches act as monitors that help you keep track of important states in your logs, like negative customer feedback, failed guardrails, or low scores from auto-evaluators. Saved searches can either be:- Private: Visible only to you, for personal monitoring and investigation workflows
- Shared: Visible to your entire team, so everyone can track important metrics and patterns together
Automations
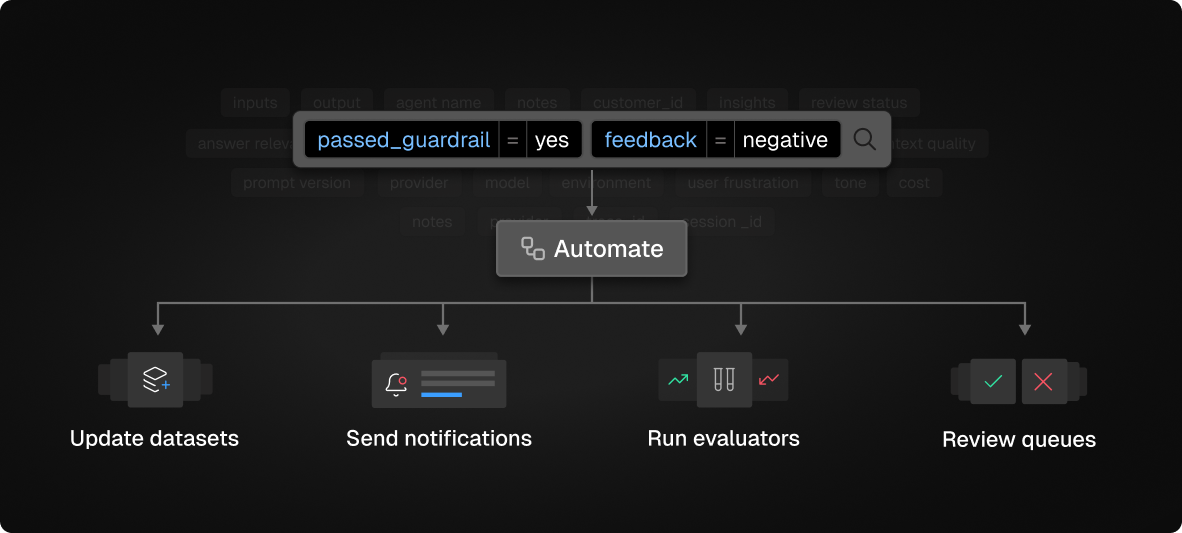
Add to Review Queue
Automatically route filtered completions to a review queue for human evaluation.
Add to Review Queue
Automatically route filtered completions to a review queue for human evaluation.
Rather than manually searching for problematic completions, automations ensure they’re surfaced to your team automatically. Configure which review queue to use, assign specific team members as reviewers (completions are automatically distributed), and set your sampling frequency, limits, and strategy (i.e. random or most recent). This will start adding individual completions or traces to the review queue in the background for you.Example use case: Automatically add guardrailed responses to a review queue so your team can evaluate why guardrails were triggered and identify patterns in edge cases.
Add to Dataset
Automatically grow your test datasets from production data.
Add to Dataset
Automatically grow your test datasets from production data.
This is particularly useful for building datasets from completions that have been reviewed, validated, or scored highly in production. Select which agent or prompt template and dataset to target, and logs will be automatically added to this dataset. This ensures your test coverage grows organically as your system encounters new scenarios in production.Example use case: Automatically add reviewed completions with high eval scores to a golden dataset for regression testing and prompt optimization.
Run Evaluations
Automatically execute evaluations on filtered completions.
Run Evaluations
Automatically execute evaluations on filtered completions.
This allows you to run specific evals only on relevant subsets of your data — saving costs and focusing evaluation effort on what matters most.Choose which evaluation criteria to run and set your sampling frequency and limits. This is especially useful for running detailed or expensive evals only on completions or traces that meet certain conditions.Example use case: Run detailed evals only on completions that already passed basic checks, or run specialized evals for specific use cases to understand nuanced quality metrics.
Get Notified in Slack
Receive alerts when filtered conditions are met.
Get Notified in Slack
Receive alerts when filtered conditions are met.
Stay informed about important patterns or issues in your production data without constantly monitoring the dashboard.Configure your notification channel in Slack, set a sampling frequency, and time period for when notifications should trigger.Example use case: Get notified when completions fail a critical evaluation metric within a time period, or when guardrails are triggered.
Creating an Automation
To create an automation, start by defining a saved search in the Observability dashboard. The saved search determines which logs your automation will act on. Once you’ve created a saved search:- Click the “Add automation” button to configure the automation
- Give your automation a descriptive name that clearly indicates its purpose (e.g., “Add to Guardrail Review” or “Add to Router Golden Dataset”)
- Select the automation type (Review Queue, Dataset, Run Evals, or Notify)
- Configure the specific options for your automation type:
- For review queues: select the queue and assignees
- For datasets: choose the target prompt or agent and dataset
- For evals: select the target prompt or agent and which evaluations to run
- For Slack notifications: configure the channel and thresholds
- Set your sampling frequency (hourly, daily, or weekly)
- Set the limit for maximum completions per sampling period
- Choose your sampling strategy (random or most recent)
- Click “Save”
Managing Saved Searches and Automations